Comparison between two groups shows runners who follow MAF training ran faster 5km times than the median of U.S. runners.
By Dr. Phil Maffetone and Ivan Rivera
Virtually all runners in 5-kilometer races predict their times. This is often accomplished by comparing shorter races, one-mile time trials, a coach’s experience, or “gut” feelings. Generalized formulas for this prediction abound too.
Studies show the best predictor of endurance race times may be submaximal performance. While a 5km race produces much faster paces than the marathon, for example, it is certainly still an endurance event. During a 5km event, the aerobic system contributes about 90 percent of the total energy, more for slower runners (with about 10 percent of energy contributed by the anaerobic system).
The accurate prediction of endurance events is important for various reasons:
- It can help monitor training progress, as runners become capable of faster training paces at the same submax heart rate (HR), race paces increase proportionately.
- It can increase race confidence by providing an easily obtained objective prediction.
- It may help predict injury or overtraining associated with autonomic imbalance as discussed below.
Prediction also can provide an important pacing strategy by helping individuals avoid running too fast at the start. Most coaches, clinicians and athletes have long known that too fast a start in events 800 meters and longer can impair overall performance. Despite this, most athletes still make the mistake of running too fast for their ability early in the event (and relative to their personal best time), and must therefore slow down too much later in the race.
Increases in higher aerobic submax capacity, e.g., progressively training faster while working at the same HR, is associated with improved competitive performance. This may be an important reason why submax pace and race performance are related. Components of this discussion were further detailed in the article on Marathon Race Prediction.
We compared submax MAF paces with 5km race times for two different sets of runners. Each runner in both groups performed at least one MAF Test and raced at least one 5km event.
Group 1: 229 runners. Data collected from randomly chosen runners in PM’s clinic between 1984-1989. (Data was split into 10 different MAF Test pace categories and averaged.)
Group 2: 10 runners. Data collected from requests emailed to philmaffetone.com members in 2016.
In study Group 1 and 2, runners performed a MAF Test based on the MAF 180 Formula, which also corresponds to one’s aerobic threshold.
In Group 1 Data, there were a number of known factors in addition to MAF Test and race results. These include:
- Runners agreed to not eat junk food and maintain a natural carbohydrate intake of 40 percent of diet or less.
- Runners spent 3-6 months building an aerobic base, training at or below their MAF HR in all workouts and not include any high-intensity training or weight lifting.
- Runners received hands-on therapy (such as biofeedback to correct muscle imbalance).
- Runners raced on relatively flat road courses.
- Runners were deemed clinically healthy and able to run, without signs or symptoms of injury or overtraining.
- Runners received one-on-one guidance regarding their training.
While we can presume that athletes following an MAF endurance training program, those in Group 2, would typically have healthier lifestyle habits than the average 5km runner, this information was not collected. For example, we don’t know if they received one-on-one professional care, how their training volume differed, chose flat 5km courses, were without health problems or consumed healthy diets.
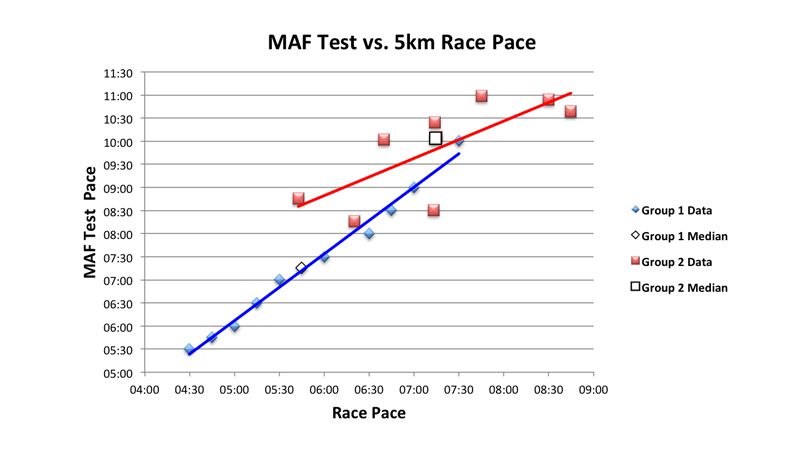
Comparison of Groups 1 and 2, with a median race pace of 5:45 and 7:14 minutes per mile respectively, is portrayed in Figure 1 below.
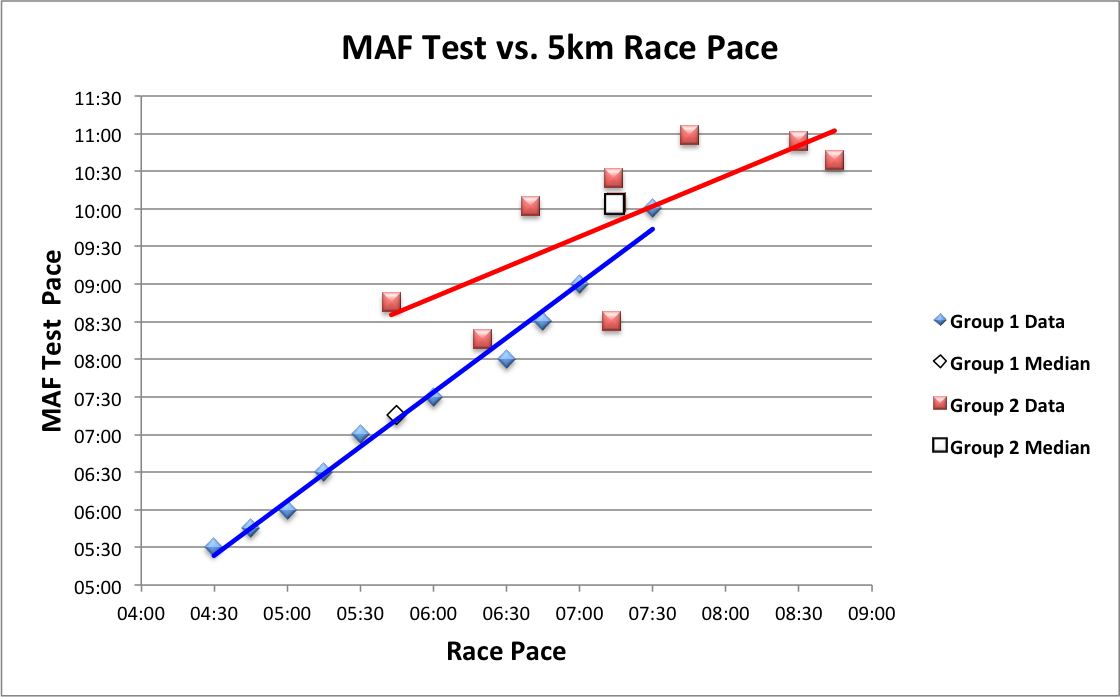
Figure 1: Relationship between 5km race pace (x axis) and MAF Test Pace (y axis) for 2 groups of runners. Graph shows group times for Group 1 and individual times for Group 2, and median times for each group. Race pace is represented as minutes per mile.
Groups 1 and 2 showed similar trends in the relationships between MAF Tests and race paces, helping to confirm the relationship between this submax test and 5km race prediction. However, overall, Group 1 significantly outperformed Group 2.
Both Group 1 and 2 performed above average for 5km race times in the U.S. In 2013, the industry trade group Running USA calculated median 5km finishing times in the U.S.(8.3 million runners): 34:53 for women and 28:46 for men. The graph below shows the relationships between median race times for Groups 1 and 2, and American runners, whose mean race pace was 10:14 minutes per mile.
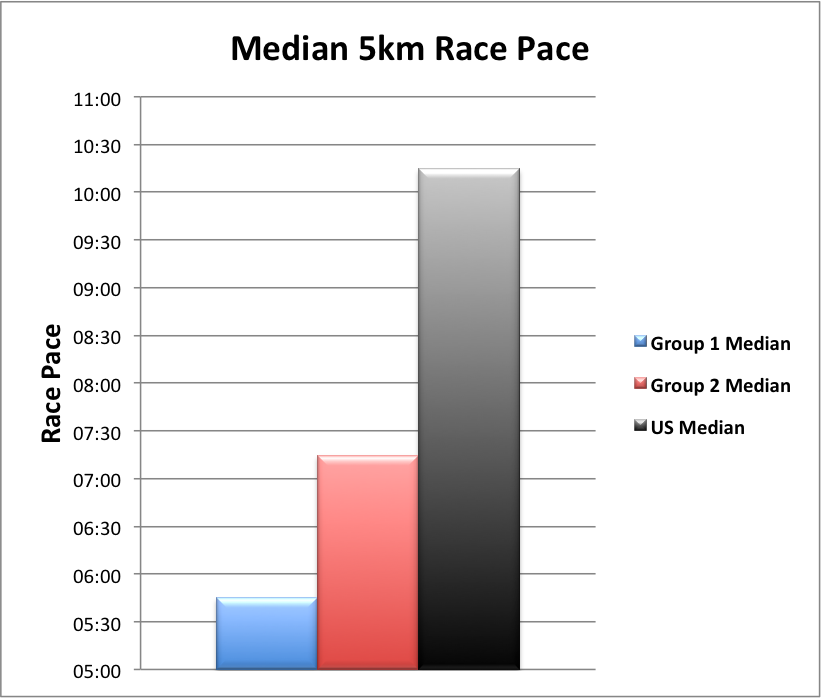
Figure 2: comparison of 5km race pace for Group 1 and 2 vs. the U.S. median 5km race pace. U.S. median 5km finishing times (ft) were converted into race pace by the following formula: ft/3.10686. Race pace is represented as minutes per mile.
In 5km events, race paces are usually faster by a certain proportion of submax training paces in runners of all abilities. On average, race pace appears to be about 90 seconds faster than one’s submax MAF Test pace, with consistent relationships between genders. This difference narrows slightly in those with faster paces and widens in slower runners. If this relationship between submax and race pace is lost, it could indicate reduced health at the expense of building fitness.
Examples include average race times that are much slower or much faster than the expected MAF Test-race pace estimate:
- Too slow a race pace relative to the MAF Test may indicate reduced fat oxidation and energy to maintain a fast pace. Or, it could be due to an irregular gait caused by muscle imbalance, reducing running economy and slowing the pace. In either situation, athletes may train with more intensity, which can further reduce fat oxidation or worsen mechanical imbalances.
- Too fast a race could be an artificially inflated pace, commonly seen in the early stage of the overtraining syndrome, where autonomic imbalance and excess sympathetic tone exaggerates strength and speed. An inflated pace may reflect improved fitness but with growing health impairments. The athlete continues training in an effort to capitalize on these perceived gains, which can fatigue the overactive sympathetic nervous system and drive the person into a more serious parasympathetic (late-stage) overtraining.
It’s possible the differences in performance between Groups 1 and 2 is associated with higher levels of overreaching in the latter as indicated by faster race paces relative to MAF Tests (not shown).
The significant outperformance of MAF runners from Group 1 versus Group 2, separated by about 30 years, could be the result of average 5km times reducing nationwide during this period (which has been observed in some endurance events).
Different performance times between Groups 1 and 2 could also be due to runners in Group 1 training and eating differently, racing on different courses, and receiving one-on-one coaching and physical treatment.
More Group 2 data that increases the number of runners in that set could allow for more accurate estimations when comparing with larger data sets of Group 1 and U.S. 5 km runners.
In conclusion, we show that runners in Group 1 and 2 who were following MAF training performed faster 5km race paces than the median 5km race times in the U.S. In addition, Group 1 runners outperformed those in Group 2.
Bibliography
Denes-Raj V and Epstein S. Conflict between intuitive and rational processing: when people behave against their better judgment. J Pers Soc Psychol. 1994; 66:819-829.
Høeg T, Maffetone P. The Development and Initial Assessment of a Novel Heart Rate Training Formula. Poster presented at the Medicine & Science in Ultra-Endurance Sports 2nd Annual Conference; May 2015; Olympic Valley, CA, USA.
Lambert MI, Dugas JP, Kirkman MC, et al. Changes in running speeds in a 100 KM ultramarathon race. J Sports Sci Med. 2004; 3(3):167-173.
Maffetone, P. Marathon Pace prediction. Independent, 2016.
Maffetone P, Laursen PB. Athletes: Fit but Unhealthy? Sports Med Open. 2015;2:24. Epub 2016 May 26.
McArdle W, Katch F, Katch V. Exercise Physiology. 3rd ed. Philadelphia, PA: Lea & Febiger; 1991.
Montgomery P, Green D, Etxebarria N, et al. Validation of Heart Rate Monitor-Based Predictions of Oxygen Uptake and Energy Expenditure. J Strength Cond Res. 2009;23(5):1489-1495.
2014 State of the Sport. Part III: U.S. Race Trends. Running USA. July 9, 2014.
http://www.runningusa.org/2014-state-of-the-sport-part-III-us-race-trends
St. Clair Gibson A, Renfree A. Influence of different performance levels on pacing strategy during the women’s world championship marathon race. Int J Sports Physiol Perform. 2013; 8:279-285.
We wish to thank those runners from both Groups 1 and 2 who agreed to participate in this study.